Rank: Member Joined: 7/3/2014 Posts: 245
|
TheGeek wrote:Metasploit wrote:Maybe you can add trendline on the charts;
we have a horizontal trend range on the KCB chart;support at 51-53 from July 2014 and last hit on 18/12/2014 (I bought at 52.50 for shorterm play),and resistance at 60-62 failed to be broken 5 times (Aug,sep,oct,nov 2014)
This implies two things;trend range may continue at least twice with possible lower lows after which we will have a very strong trend change ( a breakout above 62 or a breakdown below 51)
** 52*1.15=60 (15% price difference between support and resistance for the shorterm traders)
CFC stanbic shows the same trend range (support at 118-120,resistance at 127)It has been trying to break above the resistance since June,at the same time support has always been tested (we had price closing at 115 and touching 115 on two occassions).Same script a breakdown or breakout will be strong
** 118*1.12=132 (12% price difference between support and resistance for the shorterm traders)
Equity has been seeing lower lows after hitting the high of 63.
The last low was at 48.50,then 46 and now the price is flirting at 47 and will definately go down.
If the price goes lower than 45,we will set a new support at 50 and this will be a classical head and shoulder pattern
# At this correction cycle,bought centum at 56,KCB at 52.50 and trying KPLC at 13 Price volatility = Traders in the market. I agree on the KPLC also checkout KENGEN. UNGA is also on my radar #67 Posted : Tuesday, December 23, 2014 1:29:48 PM KENGEN @ 9 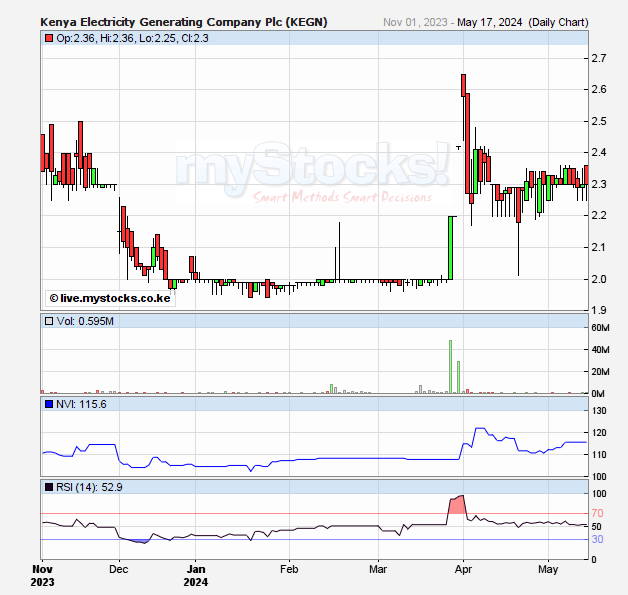 UNGA @ 35 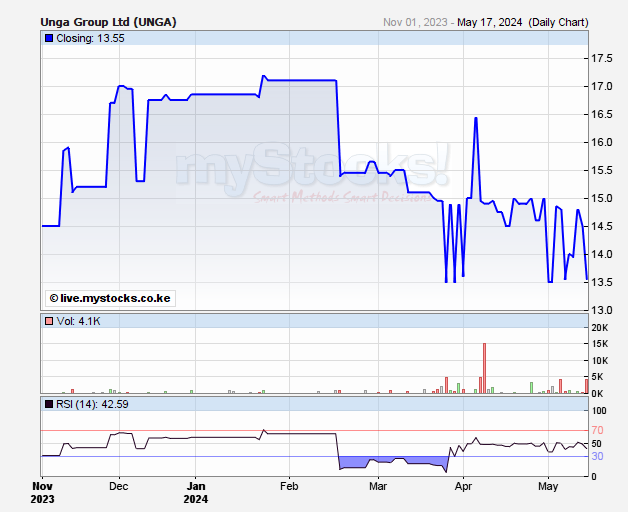 Also lookout for BAMBURI 135-140(For long term) 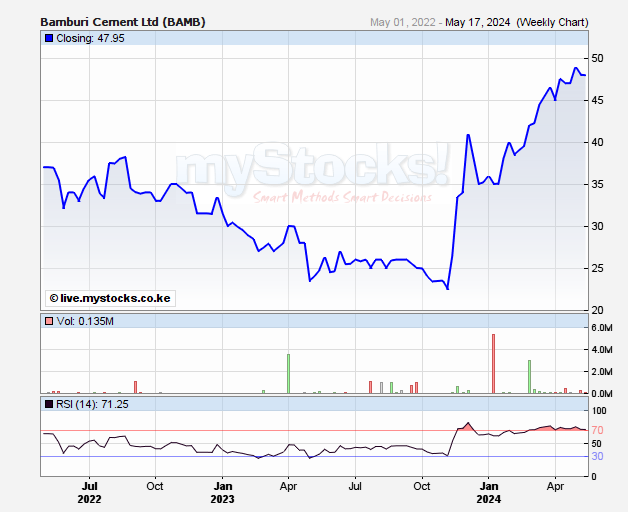 #67 Posted : Tuesday, December 23, 2014 1:29:48 PM #91 Posted : Tuesday, March 03, 2015 10:48:33 AM 1. Scangroup 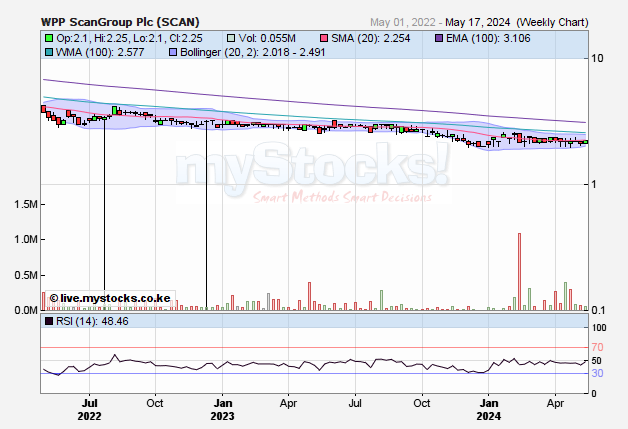 2 KENOLKOBIL 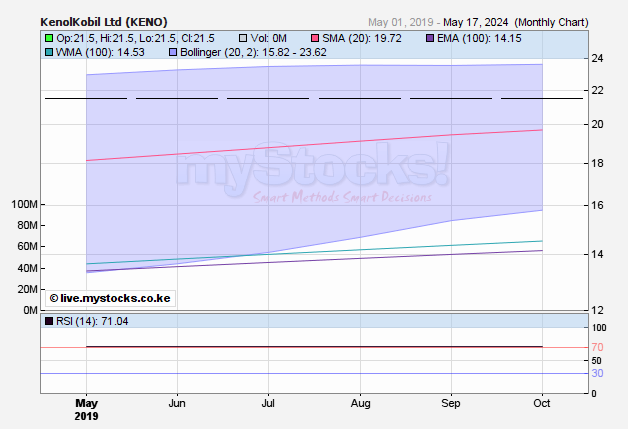 3MPESA BANK  #91 Posted : Tuesday, March 03, 2015 10:48:33 AM @metasploit @mnandii @ hisah @VVS @Philanga what say you ? In the world of securities, courage and patience become the supreme virtues after adequate knowledge and a tested judgment are at hand.
|